3 minute read
5 reasons SEQ property will continue to outperform other regions
Michael Zaghini
15/06/22
South East Queensland boasts a powerful combination of having a thriving world-class capital city, an enviable lifestyle, stunning beaches, record infrastructure investment, strong employment growth, and a high level of housing affordability. There's never been a better time to invest in SEQ than now.

Following our special report on the SEQ Property market, now is the time to capitalise on Queensland’s economic and employment growth, relative affordability, low vacancy rates, superior rental yields and declining housing supply.
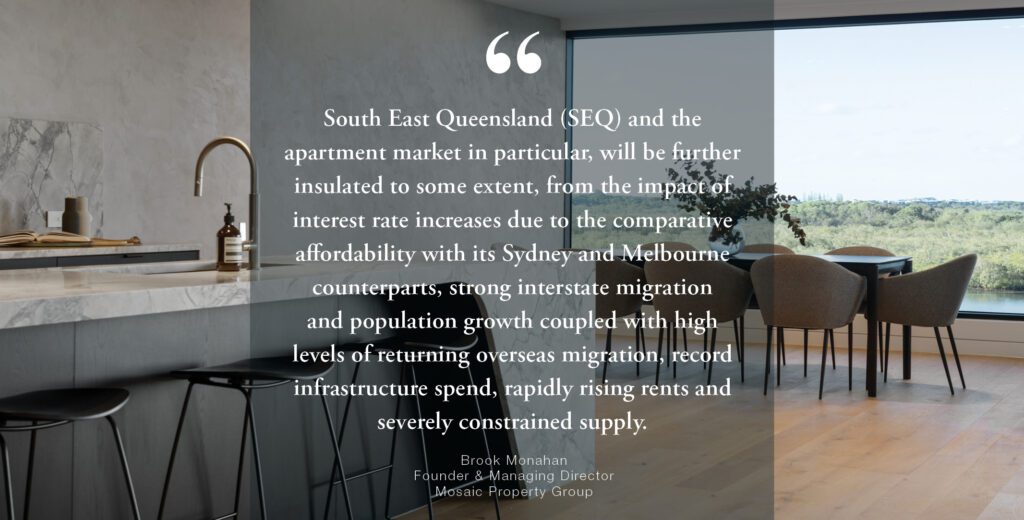
The SEQ story is a very strong one. The region should remain resilient to higher interest rates because of its relative affordability, high population growth, constrained supply, accelerating interstate and overseas migration, rising rents and low vacancy rates, and the Olympic program.
1. A Booming Population
With a population of around 3.8 million, the SEQ region is set to grow by another 1.65 million by 2041.
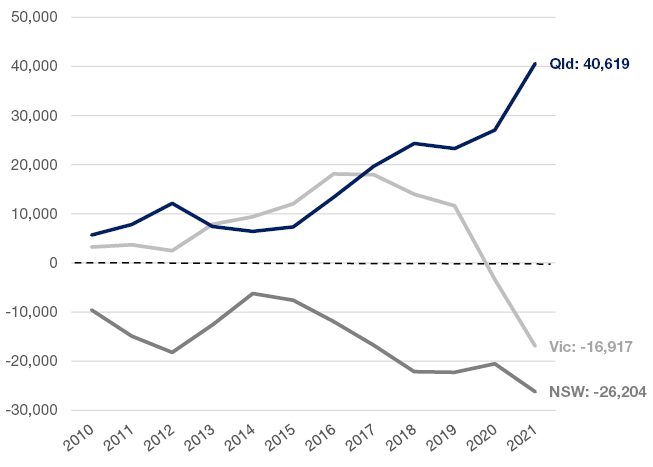
Brisbane, Gold Coast and the Sunshine Coast account for 70% of net interstate migration to Queensland which is currently at a 15 year high and far exceeds every other state in Australia.
EAST COAST CAPITAL CITY NET INTERSTATE MIGRATION
(Source: ABS)

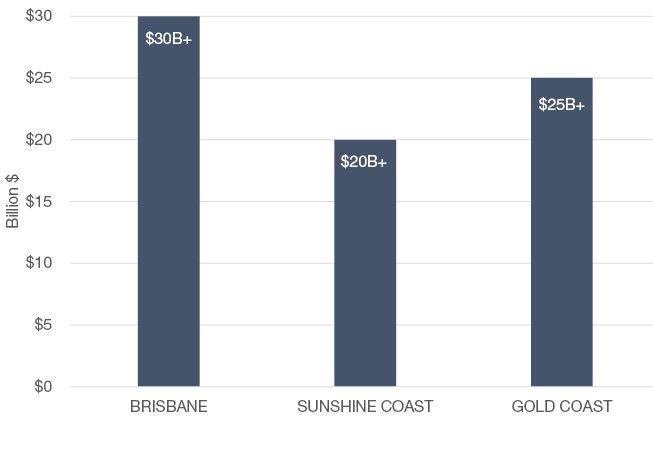
2. Significant Infrastructure Investment
The total infrastructure pipeline for Brisbane, Gold Coast and Sunshine Coast is currently $75+ billion – the greatest concentrated infrastructure boom SEQ has experienced.
The recently finalised SEQ “City Deal” is the largest in the nation and is estimated to be worth $58 billion to the local economy. Furthermore, confirmation that Brisbane will host the 2032 Olympics will sure up and boost this pipeline substantially.
SOUTH EAST QUEENSLAND INFRASTRUCTURE PIPELINE
(Source: .ID Community)

3. Strong Base Fundamentals
Economic and employment growth, relative affordability, low vacancy rates, superior rental yields and declining supply validate the SEQ investment story.
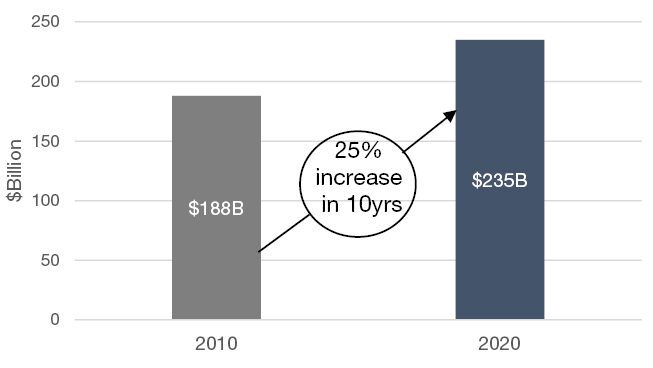
SOUTH EAST QUEENSLAND ECONOMIC GROWTH
(Source: .ID Community)
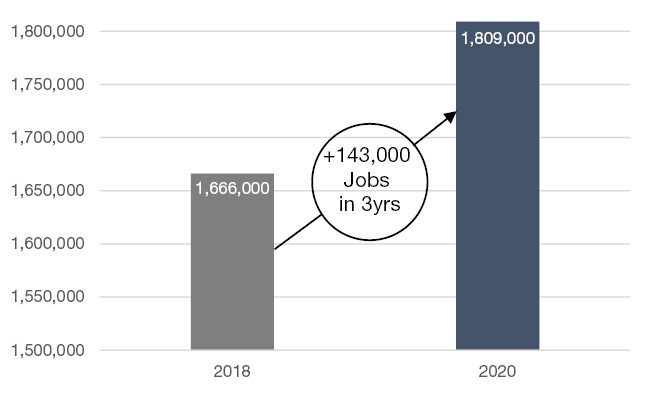
SOUTH EAST QUEENSLAND EMPLOYMENT GROWTH
(Source: ABS)
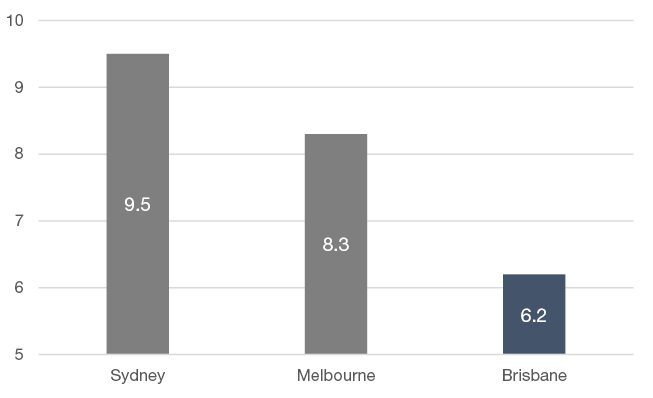
In Brisbane, it will take 6.2 times the average wage to pay off a dwelling. Comparatively in Melbourne and Sydney, it will take 8.3 and 9.5 times the average wage respectively (source: ANZ)
AVERAGE DWELLING PRICE TO INCOME RATIO
(Source: ANZ)

4. An Impeding Product Under-Supply
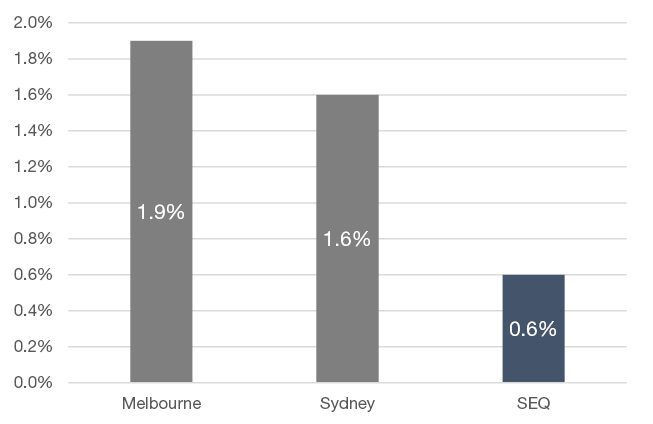
Rental vacancy rates are one of the best lead indicators of the underlying demand/supply balance in residential property markets. Vacancy rates across SEQ have been progressively declining since 2016, and now sit at all-time lows.
They have remained consistently below those in Melbourne and Sydney for a number of years. At 0.6%, the current vacancy rate across SEQ represents an extremely tight and undersupplied rental market.
RESIDENTIAL VACANCY RATES – APRIL 2022
(Source: SQM Research)
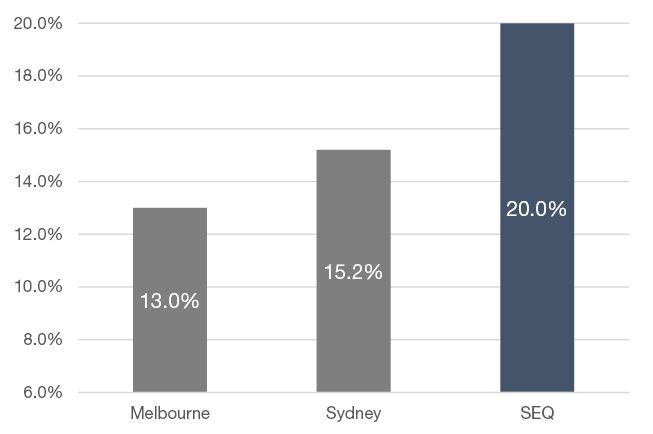
As a consequence of such consistently and comparatively low levels of vacancy, yearly rental growth across SEQ has been considerably stronger than that which has been experienced in Melbourne and Sydney.
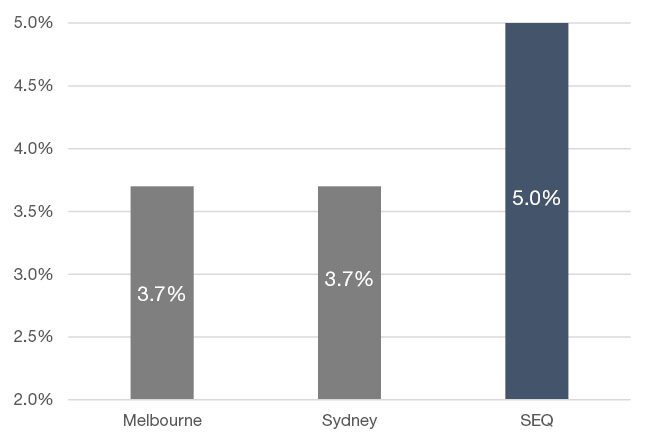
Furthermore, this growth has ensured sustained SEQ rental yields of 5%, significantly higher than those being achieved in Sydney and Melbourne which both sit at near-record lows of 3.7%.
ANNUAL RENTAL GROWTH – MAY 2022
(Source: SQM Research)
APARTMENT RENTAL YIELDS – MAY 2022
(Source: SQM Research)
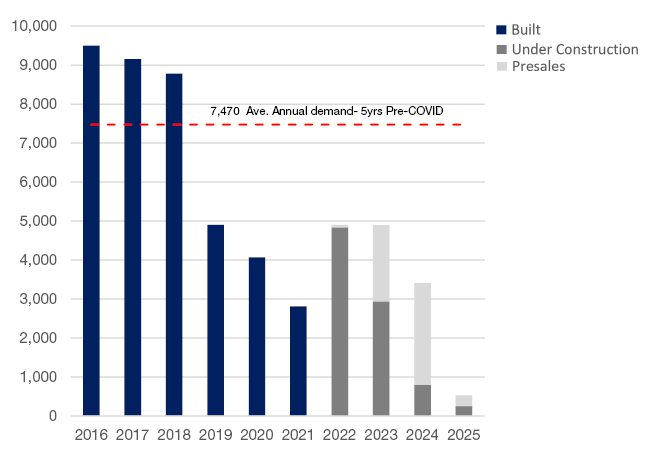
Based on historical demand and likely anticipated supply, SEQ will experience a shortfall of more than 16,500 new apartments over the next four years.
SOUTH EAST QUEENSLAND POTENTIAL APARTMENT SETTLEMENTS
(Source: CoreLogic, JLL, Place Advisory, PriceFinder)

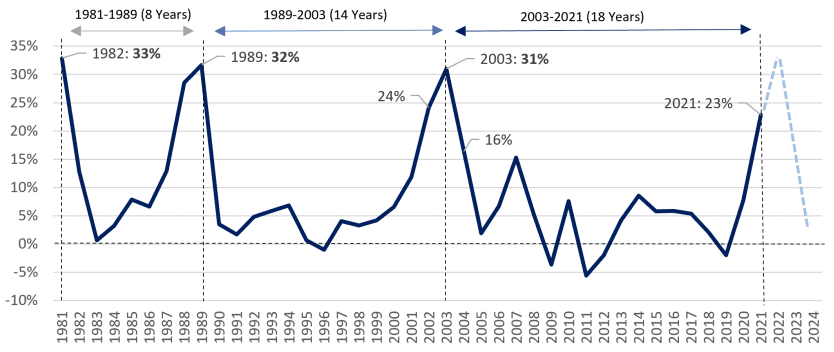
5. Strongest Performing Market this Cycle
The last true SEQ growth cycle occurred between 2001 and 2004. During this period, the region outperformed the southern capitals just as it had during previous peak growth phases.
History shows that in the context of market cycles a period of SEQ outperformance is well overdue and that the current growth cycle likely has much further to run (see diagram below).
SOUTH EAST QUEENSLAND YEARLY INCREASE IN AVERAGE HOUSE PRICE
(Source: Pricefinder)